In this week’s edition of Stats’ Sheet we will explain a few of the most common hockey advanced stats: Corsi, Fenwick, PDO, xG, GSAx, and Game Score.
Corsi
Corsi1 is a statistic used to measure shot attempt differential at even strength. It is a good, simple, proxy for puck possession, given that most shot attempts are taken in the offensive zone. Positive Corsi indicates that a team spends more time in the offensive i.e., they are taking more shot attempts, while a negative Corsi indicates the inverse, that the opponent is taking more shot attempts. By contrast the more “traditional” plus/minus where for example a +1 rating doesn’t really tell you if a team was outplayed, and they just happened to score a goal. Corsi can be calculated per player or on the team as a whole. Corsi is made up Corsi For (CF) and Corsi Against (CA)
Corsi For (CF): Shot attempts for at even strength: Shots + Blocks + Misses
Corsi Against (CA): Shot attempts against at even strength: Shots + Blocks + Misses
Corsi (C): CF - CA
Fenwick
Fenwick is very similar to Corsi, in that it measures shot attempt differential at even strength. It differs from Corsi in that it does not include blocked shots. The reasoning for this omission, given by its namesake, blogger, Matt Fenwick, was that a blocked shot is either not a true scoring chance is on average of a worse quality than an unblocked shot. As a result, it is not a good predictor of scoring chances.
Fenwick = (Shots on goal FOR + missed shots FOR) - (Shots on goal AGAINST + missed shots AGAINST)
PDO
PDO, sometimes called SPSV% is an attempt to quantify “puck luck”. It is the sum of a team’s shooting percentage and save percentage multiplied by 10. Teams will usually end up with PDOs around 100. A team with a PDO greater than 100 is probably not as good as they seem, and a team with a PDO less than 100 is probably better than they appear.
PDO = (Shooting % + Save Percentage %) * 10
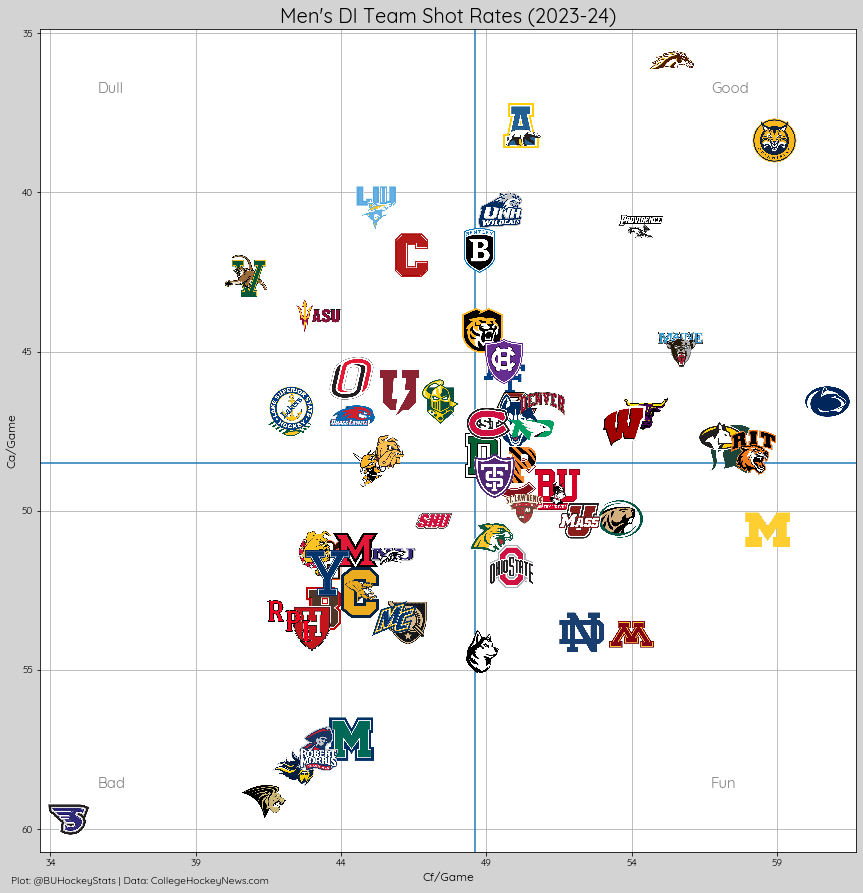
Let’s go through the above plot clockwise, starting from the top right:
Top Right: "Lucky" Teams
These teams have the best of both worlds, a high shooting percentage and high save percentage, meaning they score a lot per shot taken and do not allow many goals per shot allowedBottom Right: "Fun" Teams
These teams tend to score a lot but also allow a lot of goals, meaning their games often turn into shoot-outsBottom Left: "Unlucky" Teams
These teams have the worst of both worlds, a low shooting percentage and low save percentage, meaning they allow a lot of goals but also don’t score many per shotTop Left: "Dull" Teams
These teams tend to be involved in games that are usually low scoring defensive/goalie battles, games that some would call “dull” or “boring”
Expected Goals (xG)
Expected Goals, or xG, is the hot, new, advanced stat in hockey. xG uses a statistical model based approach to determine the probability that a shot, given its location on the ice, the type of shot, the phase of the game, and other factors (each xG model may produce a slightly different xG for a given shot). It attempts to quantify how many goals a player or a team is expected to score. For example, a shot from the slot from a set power play has a higher xG (read: higher probability of a goal), than one from the blue line on a 3×5 through traffic. As can be seen below, shots closer to the net have a higher chance of being goals.

Goals Saved Above Expected (GSAx)
An extension of xG is Goals Saved Above Expected, or GSAx, a goalie stat that attempts to quantify how many goals a goalie has saved above (or below) they are expected to save. A positive value means that a goalie is saving more goals than the average goalie would. An example of a goalie’s GSAx (Mathieu Caron (BU), 2023-24) over a season is pictured in the table below. In this example, BU had a 22-2-1 record when Caron has a GSAx > -.7 and a majority of the team’s losses occurred when he had a GSAx ≤ -1.8.
GSAx = Expected Goals Allowed (xGA) - Goals Allowed (GA)
Game Score
Game Score is a metric created by Dom Luszczyszyn of The Athletic, the metric is originally a baseball stat created by legendary baseball statistician Bill James. It is a way to quantify a player’s single game performance. Luszczyszyn release his initial version of the metric in 2016 and an updated and improved version in 2020.
Game Score 1.0
The initial formula for the metric uses goals, primary assists, secondary assists, shots on goal, blocked shots, penalty differential, faceoffs, 5-on-5 corsi differential, 5-on-5 goal differential (i.e., +/-). The weights, as determined by Luszczyszyn, are meant to make Game Score roughly equal to points, to be easy for people to understand intuitively. The issue with this initial formula is that defense is underrepresented, resulting in defenseman being underrated. Additionally, defenseman performance is scored equally to that of forwards, resulting in a lower game score for them by virtue of the fact that they don’t score or attempt shots or take faceoffs as much as forwards.
Skater Game Score = (0.75 * Goals (G)) + (0.7 * Primary Assists (A1)) + (0.55 * Secondary Assists (A2)) + (0.075 * Shots on Goal (SOG)) + (0.05 * Shots Blocked (BLK)) + (0.15 * (Penalties Drawn (PD)) – (0.15 * Penalties Taken (PT)) + (0.01 * Faceoff Wins (FOW)) – (0.01 * Faceoff Losses (FOL)) + (0.05 * Corsi For (CF)) – (0.05 * Corsi Against (CA)) + (0.15 * Goals For (aka Plus) (GF)) – (0.15* Goals Against (aka Minus) (GA))
Goalie Game Score = (-0.75 * Goals Allowed (GA)) + (0.1 * Saves (SV))
Game Score 2.0
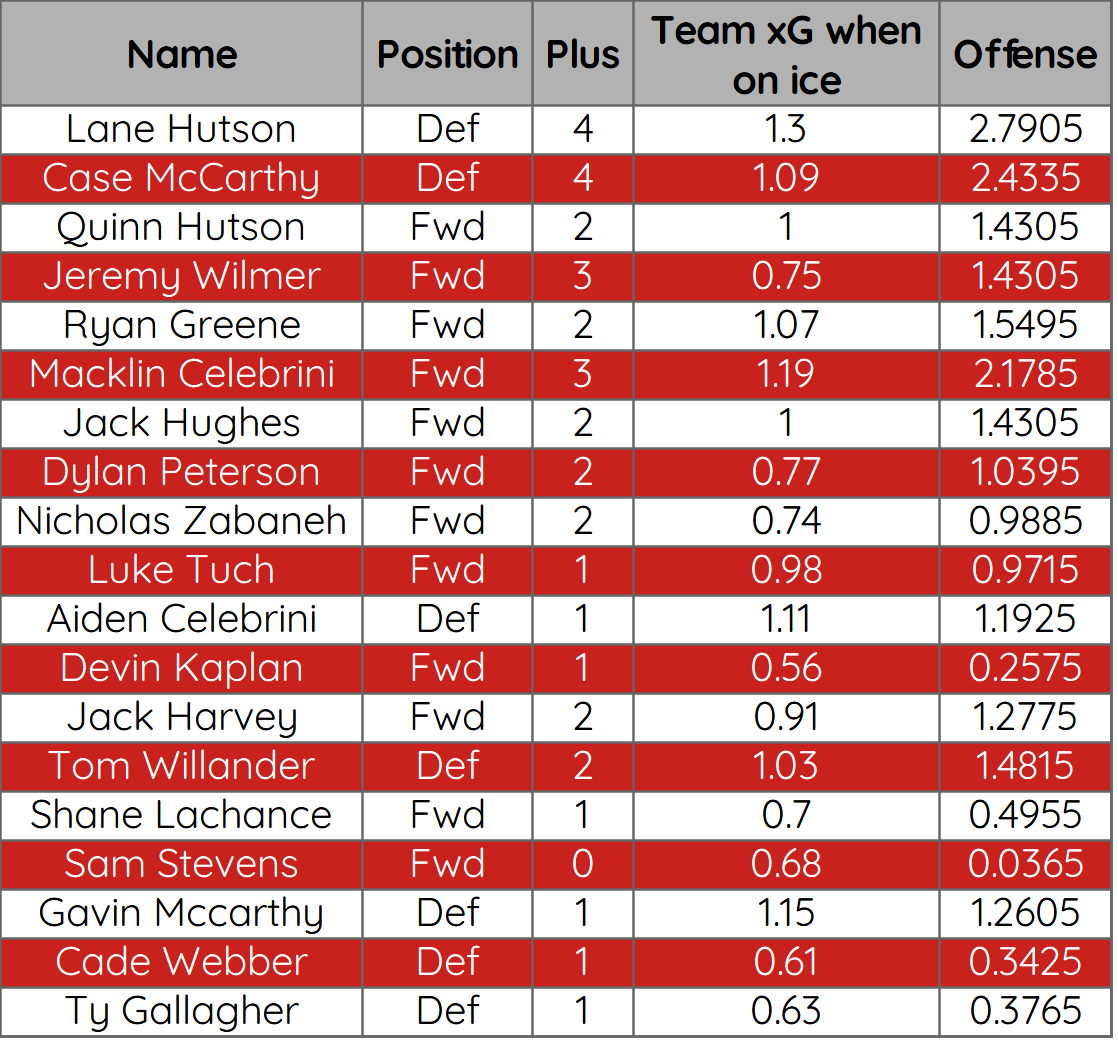
In 2020, Luszczyszyn redesigned his Game Score formula to better account for both shot quality and defense. With regard to shot quality, Corsi was replaced with xG which, as we’ve previously discussed, does a better job at quantifying shooting ability. To better account for defense, the formula was adapted to have different weightings for forwards and defensemen, boosting the weight for defenseman play-driving (i.e., xGF and xGA) to counterbalance the countable stats that forwards are more likely to produce. Also, a huge thanks to Stephen Zenack at The Field House for adapting Luszczyszyn’s model to college hockey. To show how this new version of Game Score is calculated, we will use BU’s game vs. Merrimack on February 9th, 2024, a 7-1 victory for the Terriers. Game Score can usually be broken down into four sub-metrics: Offensive Impact, Defensive Impact, Production, and Miscellaneous.
Weightings:
Forward Expected Goals For (xGF): 0.625
Forward Goals For (GF): 0.625
Forward Expected Goals Against (xGA): 1.75
Forward Goals Against (GA): 0.4375
Defenseman Expected Goals For (xGF): 1.7
Defenseman Goals For (GF): 0.425
Defenseman Expected Goals Against (xGA): 2.3
Defenseman Goals Against (GA): 0.575
Offensive Impact
Offensive Impact or Offensive Impact above average takes into account a player’s impact relative to the team and to the national average, to determine how far above the impact of the average player is their offensive performance. Note: All components of Offensive Impact are at EV
Offense = (Team xG when on ice - National Average Team xG when on ice)*xGF Weight + (Goals For (i.e., Plus) - National Average Goals For)*GF Weight
Defensive Impact
Defensive Impact or Defensive Impact above average takes into account a player’s impact relative to the team and to the national average, to determine how far above the impact of the average player is their defensive performance. Note: All components of Defensive Impact are at EV
Defense = (Opponent's xG when on ice - National Average Opponent's xG when on ice)*xGA Weight + (Goals Against (i.e., Minus) - National Average Goals Against)*GA Weight
Note: Defensive Impact is subtracted from the total in the final Game Score calculation (i.e. the “best” Defensive Impact would be - (National Average Opponent's xG when on ice)*xGA Weight) - (National Average Goals Against)*GA Weight)
Production
The “Production” component takes into account player’s points, with the primary assist having a greater weight than the secondary assist, and individual actions (i.e., individual xG). xG taking the place of Shots on Goal to more accurately quantify the player’s shooting ability.
Production = (0.75 * Goals) + (0.7 * Primary Assists (A1)) + (0.55 * Secondary Assists (A2)) + (0.5 * Expected Goals (xG))
Miscellaneous
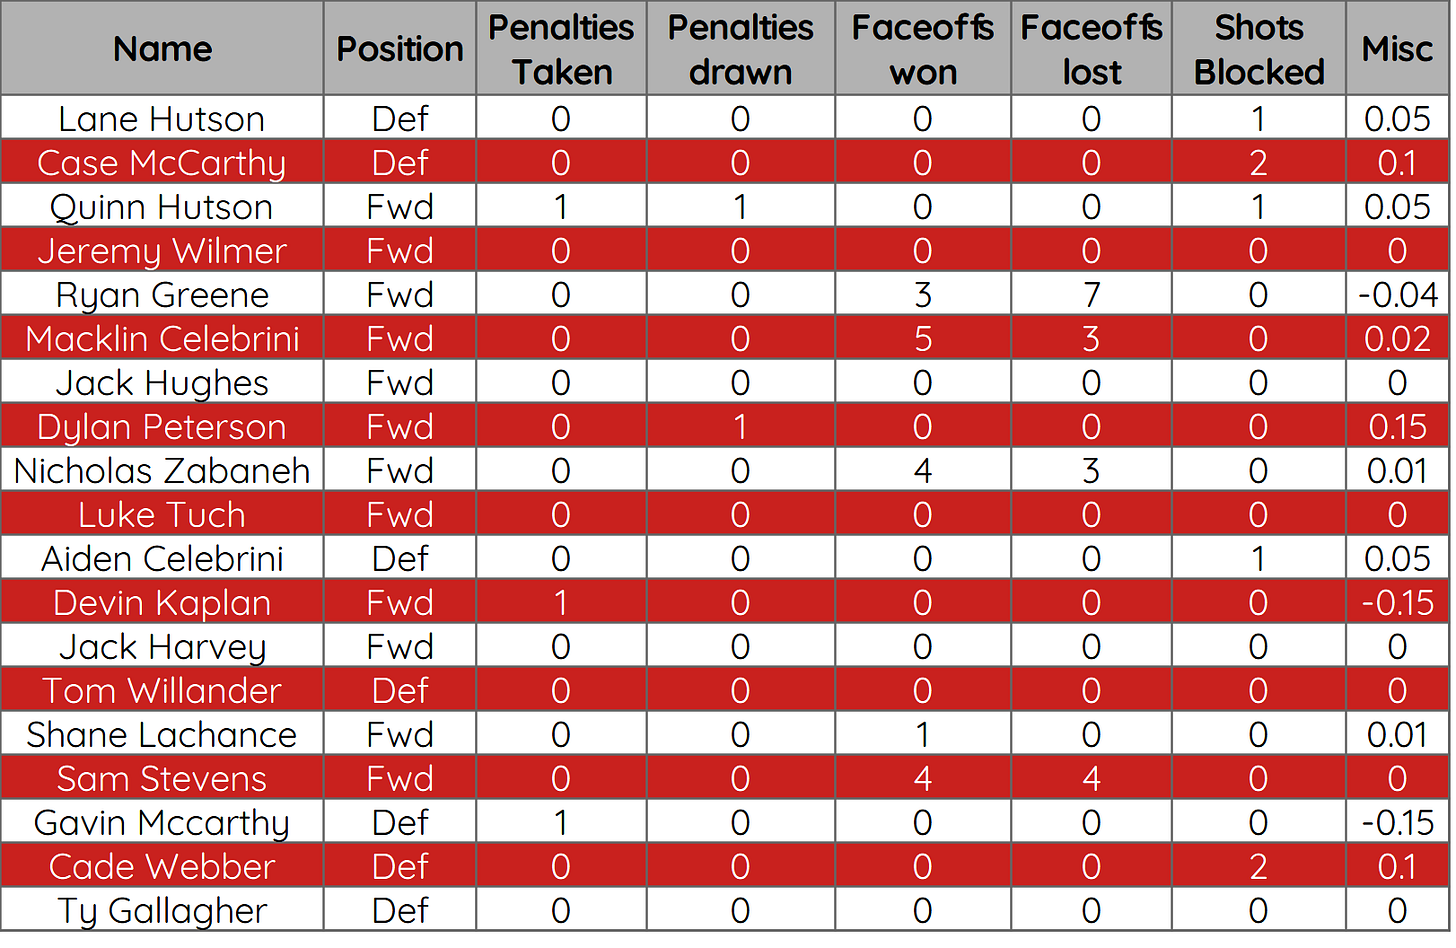
The final component is “everything else” that a player does that is “countable”: blocked shots, faceoffs, and penalties
Misc = (0.05 * Shots Blocked) + (0.15 * Penalties Drawn) - (0.15 * Penalties Taken) + (0.01 * Faceoffs Won) - (0.01 * Faceoffs Lost)
When we put those all together, we get a player’s full impact on the game, as can be seen in the chart below (Overall Game Score can be found next to the player’s name).
Conclusion
There are countless other advanced stats and metrics that are useful in measuring various aspects of a player’s or team’s performance. In addition, plot and graphs can be generated combining xG and Corsi to illustrate which teams or players are taking quality chances compared to others, a plot with xG and Goals can show who are the “luckiest” players.
Named after former Buffalo Sabres goaltending coach Jim Corsi, because it’s creator, Vic Ferrari saw a picture of Corsi and liked his mustache and the sound of his name. Originally, Ferrari wanted to call it the Regier Number, as he had heard Sabres GM Darcy Regier talking about shot differential on a radio interview which led to the formula's development. However, he did not like how it sounded nor did he like how it sounded to call it the Ruff Number after Sabres Head Coach Lindy Ruff.


This was incredibly useful, thank you. As an amateur hockey blogger for a European team, how would you recommend trying to calculate xG by tracking it manually during a game? I've heard you can do it manually with a printout, but any advice you have would be appreciated!