Finding the Plot 2: Tourney Edition
Seeing what we can see in the Advanced Metrics for the 2025 NCAA Tournament Field
Back in November, we looked at where the tournament teams stand in various advanced metric. Now, as we enter the final phase of the season, we take a look at where the teams that earned their spot to play for at National Championship stand among their peers.
Expected Goal Rates
Expected Goal (xG) rates are a good analog for shot quality, showing how well a team takes quality chances and how well a team limits their opponent’s quality chances. With regard to all situations, all but 3 teams are within the top right quadrant, meaning they are above average in xGA/G and xG/G. Of the three outside the box, BU is essentially the national average for both metric; Minnesota State is just below average in xG/G but are second in the nation xGA (2.47); and Penn State is a real outlier where they allow their opponents a lot of high quality shots per game but also record a lot of high quality shots.
In terms of Net xG: Denver (1.25), Cornell (1.13), and Minnesota (1.09), Maine (1.07), Quinnipiac (1.03), and Western Michigan (1.03) lead the pack, the only teams with a net xG over 1; Michigan State (0.96), Bentley (0.89), and Boston College (0.87) are next up, the only others with a net xG over .6; Minnesota State (0.58), Providence (0.42), UMass-Amherst (0.39), and Ohio State (0.36) round out the next group, the remaining teams above 0; and finally Boston University (0.00) and Penn State (-0.05).
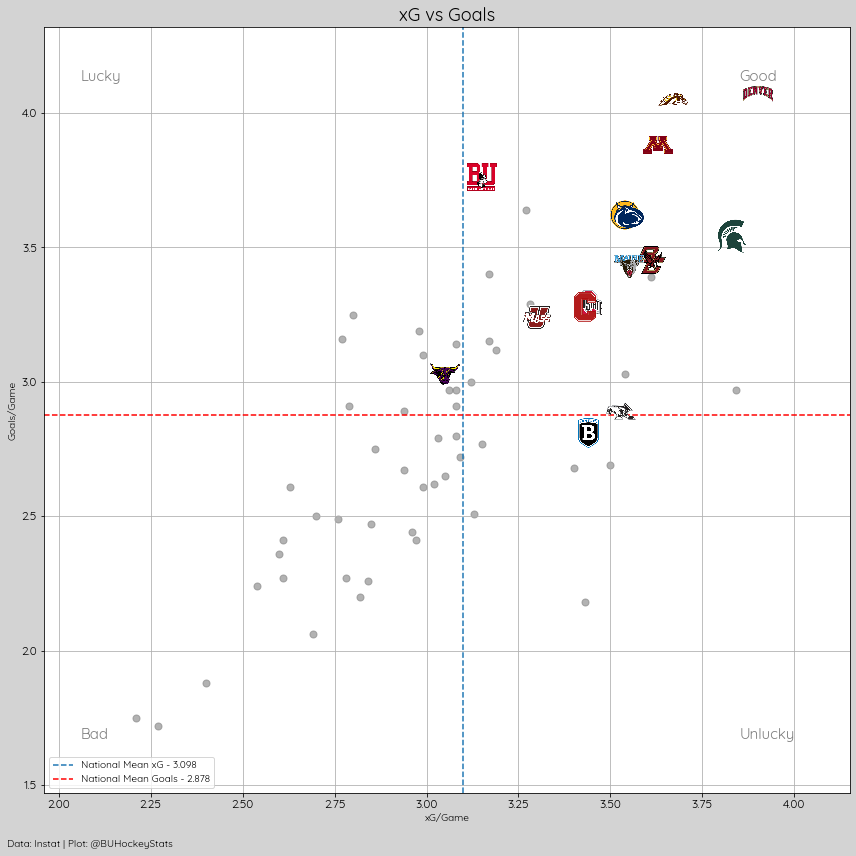
xG vs. Goals
Unsurprisingly, all 16 teams are in the top right quadrant (or just barely outside it). Every team is scoring within a goal of what they’re expected to. BU leads the group, averaging .61 goals more than expected, while Providence is on the other end of things, averaging .64 less than expected.
xG vs. Corsi
Looking at xG vs. Corsi For (i.e., Shot Attempts), we can see how good a team’s shots are. Michigan State is far and away this best team in this aspect, they are taking a lot of shots, and they are of high quality. All teams outside of Cornell and BU are above average in Corsi at even strength, and all teams outside of BU are above average in xG at even strength.
Penalties For/Against
Looking at PIM For in a vacuum doesn’t tell much about whether a team just happens to play in games that just have a bunch of penalties, rather than the team itself being undisciplined. BU games tend to see a fair share of penalties, however, many of those games occurred in the first half of the season and the Terriers’ penalty rate has lowered in the first half. It is interesting to see that the tournament teams are far more distributed in the quadrants in this plot than in the others we’ve looked.
Conclusion
Taking all these plots together, you can see that these 16 teams really are top teams. No team is a huge outlier relative to the rest. Even on the upper end, no one team is really dominating, there are groups and clusters of high performing teams. It should be a fun and exciting two weeks, of best-on-best hockey.


