In this edition, we’re going to take our first look at where the DI men’s teams stand in various metrics, as the Ivy League teams have joined the fray.
Expected Goal Rates
Expected Goal (xG) rates can show us how well teams are at taking quality shots and limiting their opponents quality shots. Noticeably, BU is below average in xGA/Game in “All Situations” while they are slightly above average at even strength, which helps to illustrate why their penalty kill has had such a low success rate.
The Top 10 teams in Net xG (xG - xGA) are: Maine (17.9), Minnesota (17.2), Denver (14.6), Quinnipiac (11.4), Michigan (11.0), Western Michigan (10.9), Ohio State (9.7), Arizona State (9.4), Bentley (9.3), New Hampshire (8.4)
The Bottom 10 in Net xG are: Northern Michigan (-22.2), Stonehill (-16.0), American International (-11.5), Ferris State (-11.3), Lindenwood (-10.8), Army West Point (-10.5), Merrimack (-9.2), RIT (-9.2), Augustana (-8.3), St. Cloud State (-7.7)
xG vs. Goals
By comparing expected goals (xG) to goals, you can illustrate how “Lucky” or “Unlucky” a team is. For example, Wisconsin is averaging 4.01 xG per game but only scoring 2.25 goals per game, the biggest gap in the NCAA. Eventually those rates should converge.
The biggest outliers are Wisconsin (1.76) Harvard (1.18) —the only two schools with an xG/Goal differential over 1—and Dartmouth (-1.41) — the only school scoring, on average, a goals or more over their expected rate.
Corsi For vs. xG
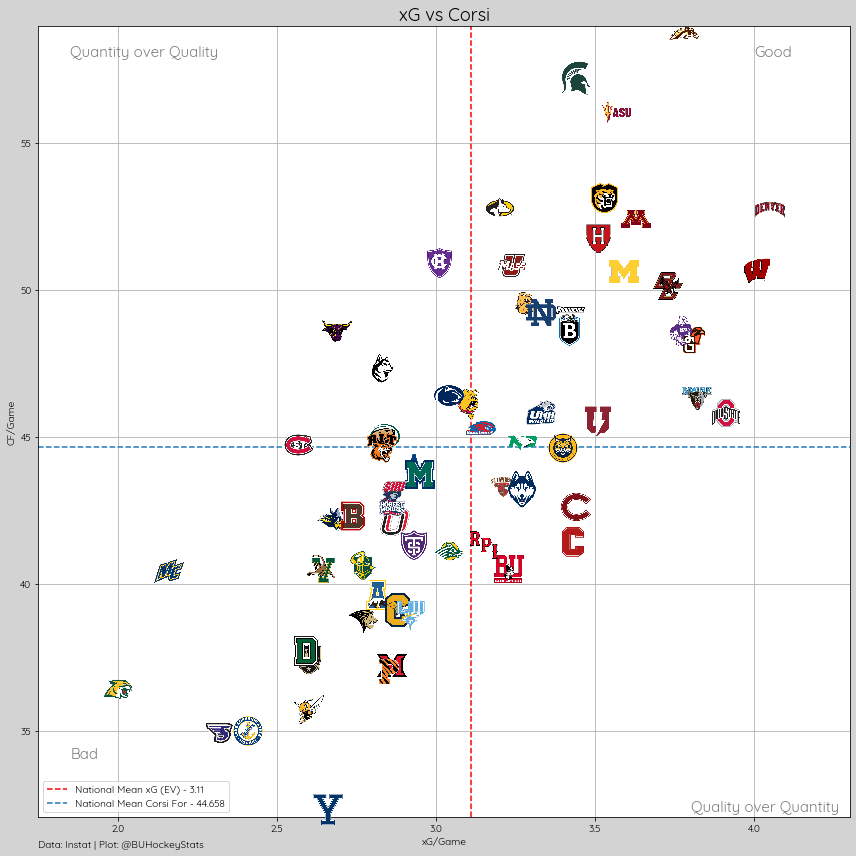
Looking at Corsi For (i.e., Shot Attempts) vs xG, we can see how good a team’s shots are. Some teams, such as Minnesota State, take a lot of shots but are low quality shots, as a result these teams are less likely to score goals. Other teams, like Cornell and Colgate, don’t take as many shots, but when they do, they have a higher chance of scoring.
Penalties For/Against
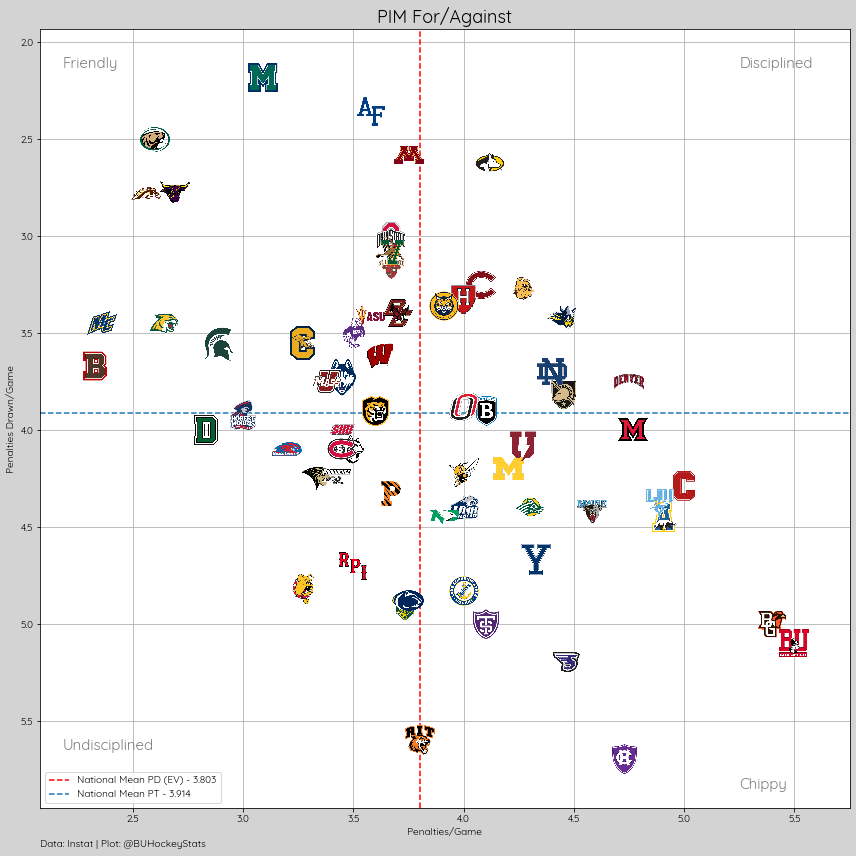
Is a team undisciplined, or do their games just get “chippy”? Comparing a team’s PIM For and Against, you can see if a team is taking too many penalties or their games are just penalty fests. For example, BU leads the nation in PIM, however in two of their highest PIM games, vs Holy Cross (Oct 5th) and vs. North Dakota (Oct 25th), BU recorded 46 and 29 PIM, respectively, while their opponents recorded 37 and 20 PIM.
Conclusion
Taking all these plots together, you can get a fuller picture of where a team stands. For example: Denver—the undefeated, 12-0-0, reigning National Champions, are in the top right quadrants in each of the plots (the place you want to be), they’re taking more quality shots than they’re allowing, they’re taking a lot of shots, those high quality shots are going in, and they are disciplined. Taking all that together, it makes sense that they are where they are, at the top of the sport.


