

The Continental Divide 2: 2East 2Biased
In this edition of The Continental Divide we take a look at how newly suggested regional format will affect team travel distance.

Last season we did our first deep dive into the current system of regionals. This year we’re looking into proposed changes to the system and how they would affect travel using data from the last 12 tourney (since 2014).1

Setup
We will go through each proposed “system” starting with the current system, followed by the switching to the top seed hosting the 4-team regional, ending with the wildly different system in which the top eight teams host the bottom eight teams in week one followed by the top four remaining seeds hosting the bottom four remaining seeds.
We’ll look at average travel distance, amount of flights vs. busses—NCAA requires teams to drive if a tournament game is less than 400 miles—and total travel distance.
Current System
The current system has been in place since 2003 and sees the 16 team tournament divided in four neutral regional sites with four teams each.
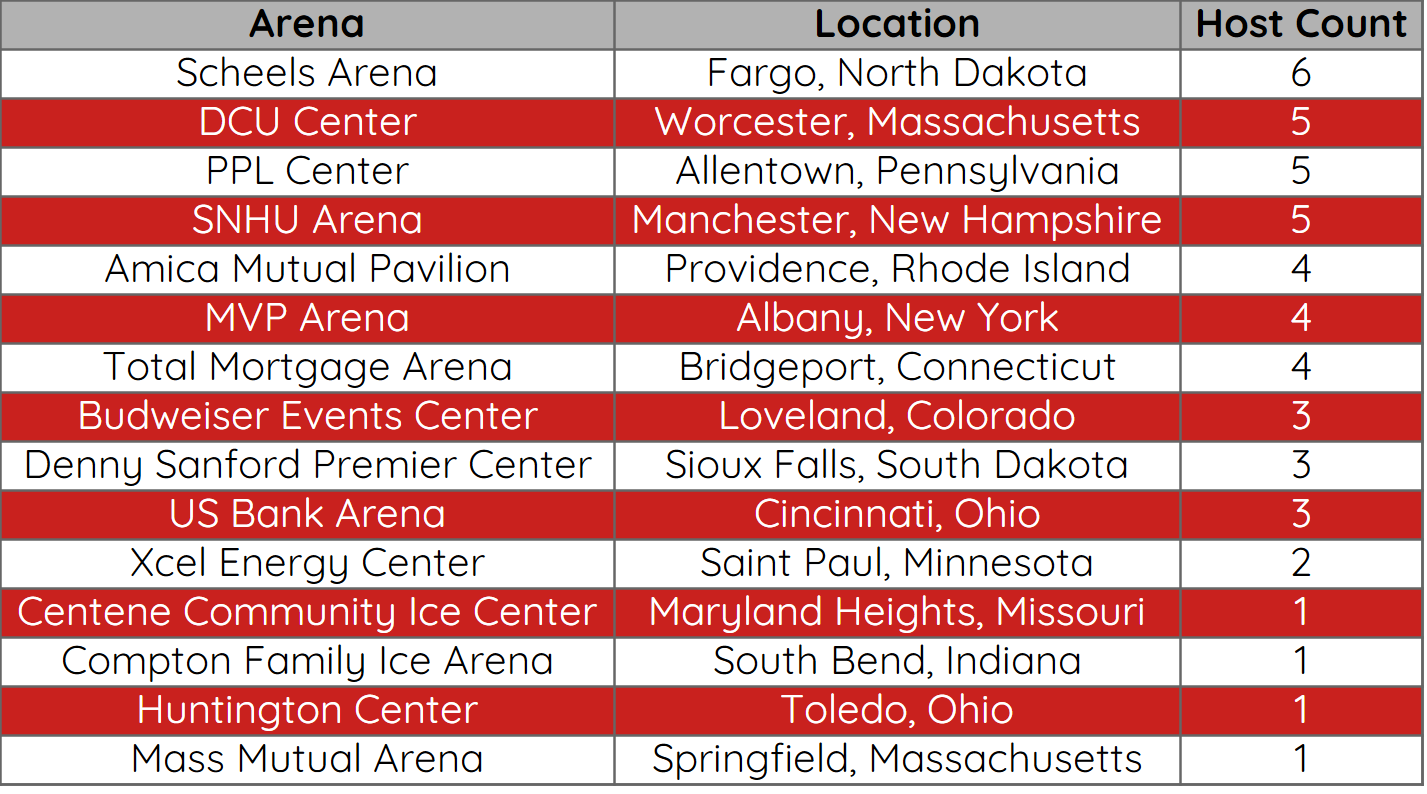
Since 2014, 15 different arena have hosted regionals led by Scheels Arena in Fargo, North Dakota—2015, 2017, 2019, 2021, 2023, and 2025.
Under the current system, Denver is one of the “biggest loser” having to fly for 9 of their 11 of their regionals (81.8%). The only two instances of being able to bus were the two times they hosted a regional in Loveland, Colorado in 2022 and 2026. Michigan and Notre Dame are also among the biggest losers both being forced to fly to 85.7% of regionals (6 of 7).
The “biggest winner” in this system is Providence who was able to bus to 7 of their 8 tournament sites (87.5%), the only exception being 2026 when they were sent to Sioux Falls, South Dakota. Quinnipiac is also a big winner in this system also being able to bus to 7 of their regionals.
In total in the current system, there were 102 instances of teams busing to regionals (53.13%) and 90 instances of teams flying to regionals (46.88%) out of 192 opportunities.
Every team—except Air Force—with multiple NCAA tournament appearances in this span were able to bus to at least one of their appearances. Penn State and Boston College were the only teams with 3+ appearances to not have to fly to any regional.
Average combined travel distance for all teams in the current system: 520.01 miles
Top Seeds Hosts
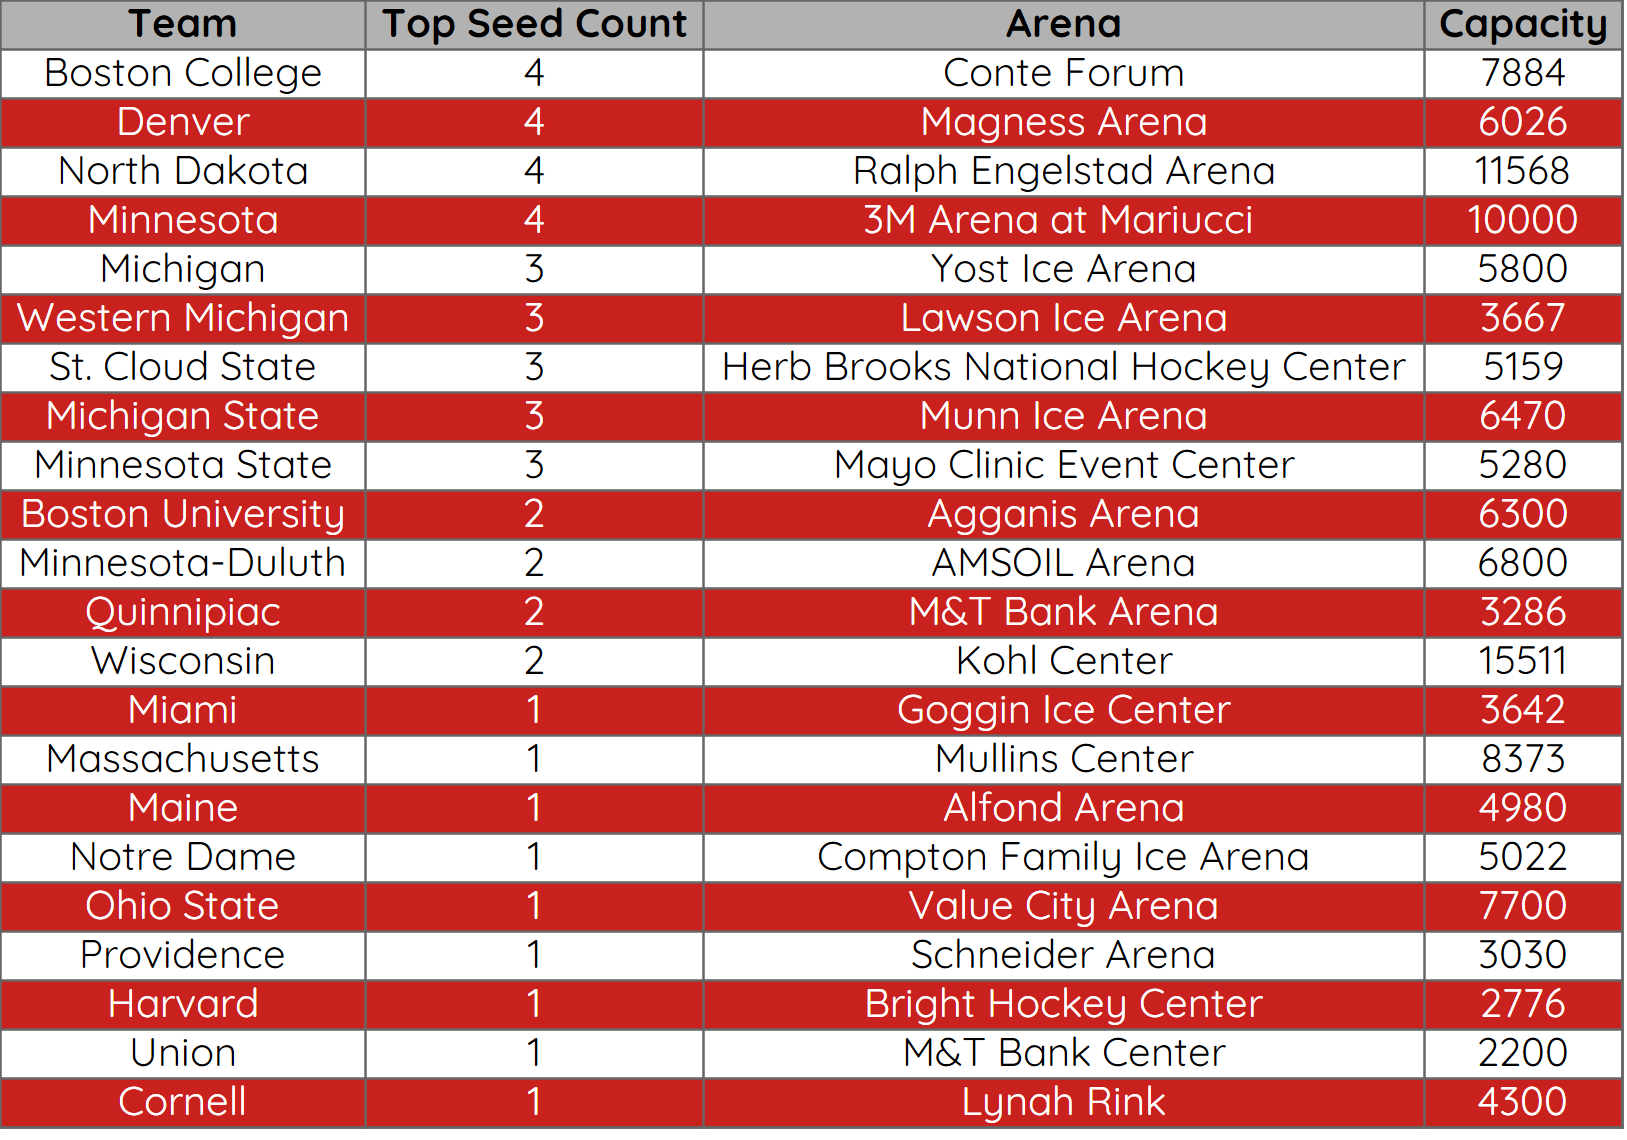
Next up we’ll look at travel if the top seeds host each of the four regionals. In total, 22 different arenas would have hosted regionals—up from 15 in the current system in that span—with Conte Forum (BC), Magness Arena (DU), Ralph Engelstad Arena (UND), and Mariucci (Minnesota) each hosting 4 times.
This new system decreases the number of teams flying >50% of their appearances from 19 to 17, a quite small decrease.
Let’s look at how this system changes the amount of travel and the amount of flights. Denver and Minnesota State are big winners in reducing their travel distance, with Denver traveling on average 418.257 miles less and Minnesota State traveling 376.881 miles less. In terms of flights, Michigan drops their number of flights by 4.
On the other end of the spectrum, Cornell’s number of flights increases by 5 and their average travel distances increasing by 361.116 miles.
Overall this system increases the total number of flights from 90 to 97 and drops the total instances of busing from 102 to 95.
Average combined travel distance for all teams in the a system in which the top seeds host: 498.51, a decrease of 21.49 miles.
Top 8 Seeds Host, Bottom 8 Seeds
In what would be a major shift in the system, we look at what a system that sees the Top 8 seeds, host the bottom 8 seeds at home in weekend one of the tournament. In weekend two, the top 4 remaining teams would host the bottom 4, a week later. For simplicity we are utilizing the first round matchups of the last 12 tournaments. In this “new” system the amount of top seeds winning would most likely increase but we will assume the first round winners will be same for simplicity.
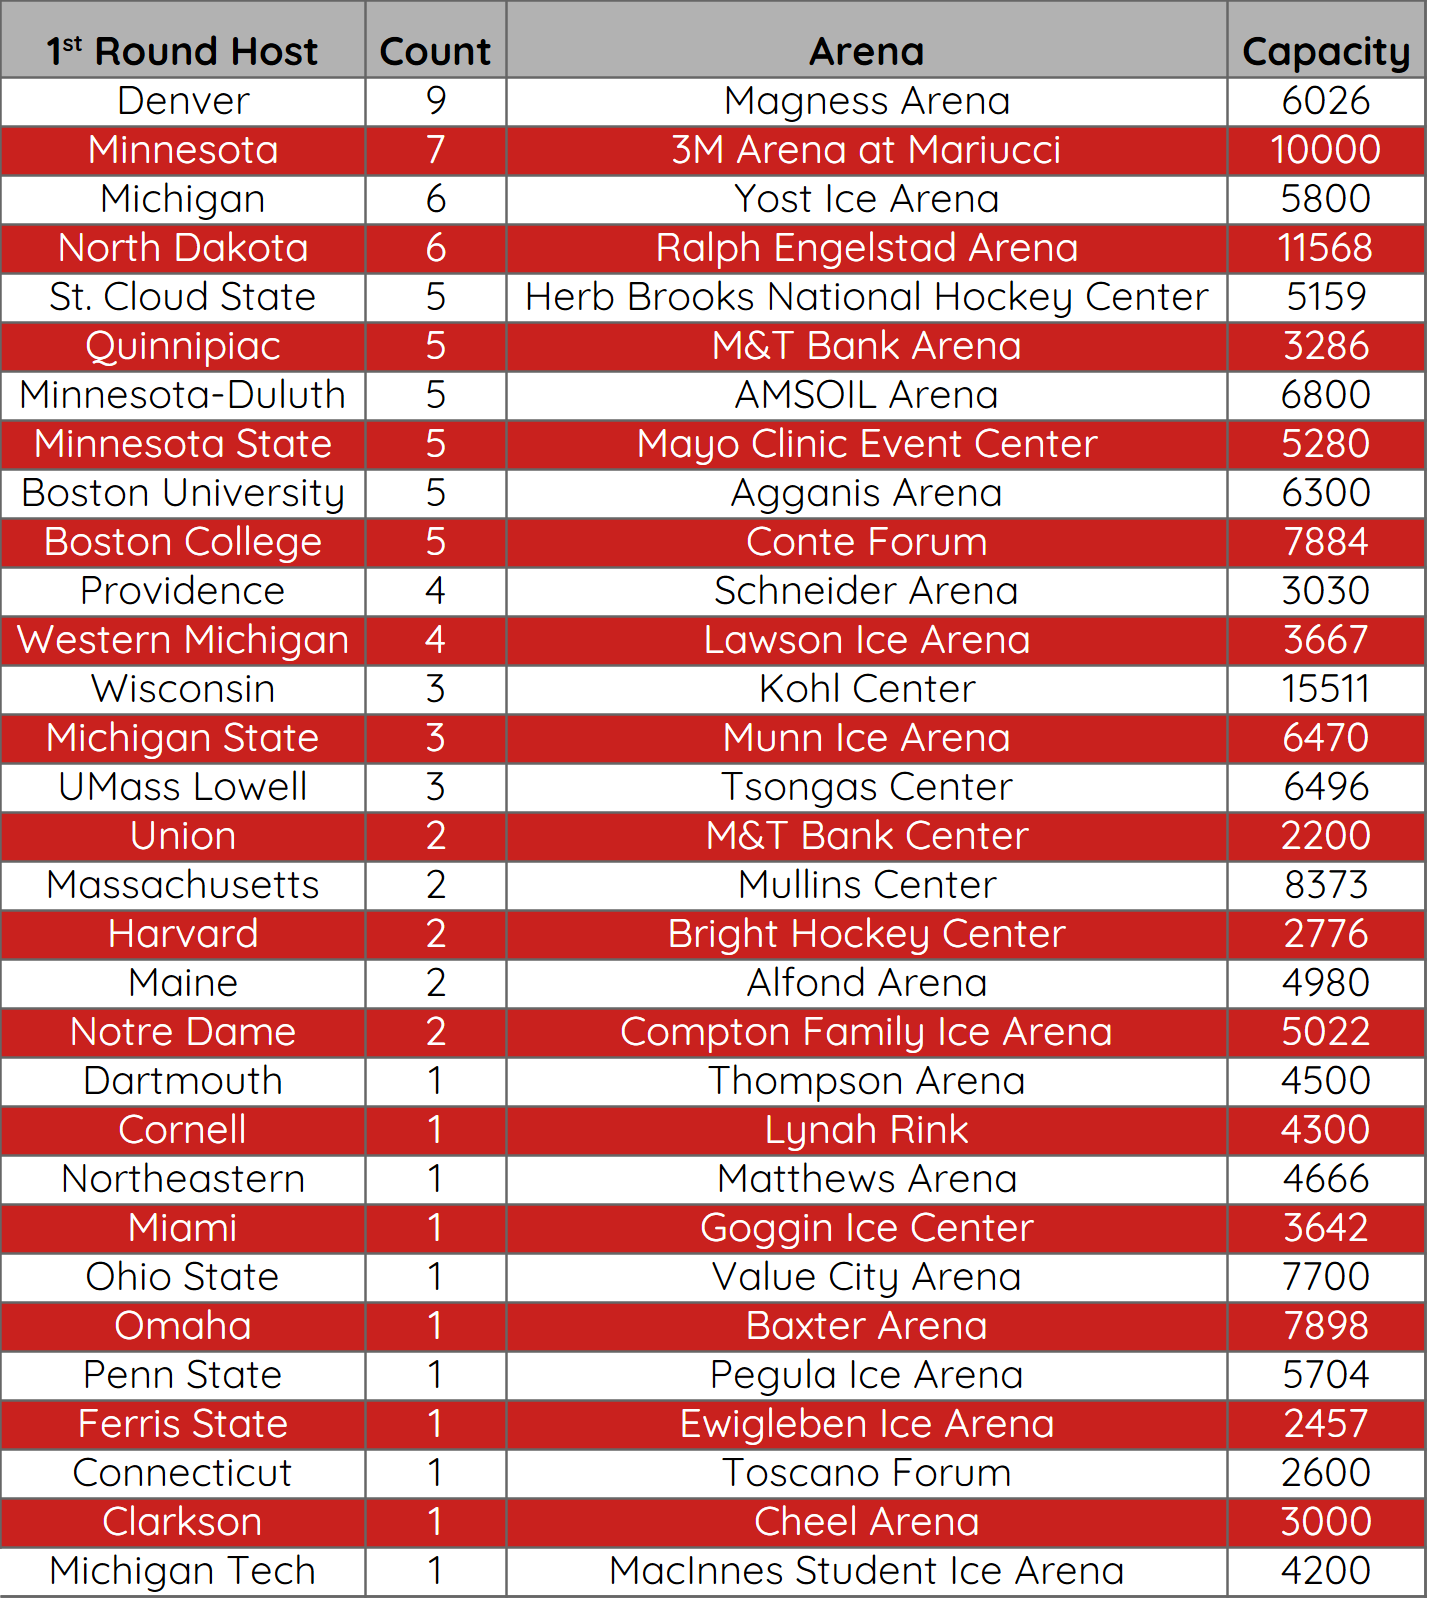
31 different venues would host first round games in this format in the same span. If you just look at post the last 6 tournaments we’d only see 20 different venues with Minnesota hosting in 5 of 6 and Michigan, Denver, and North Dakota hosting in 4 of 6.
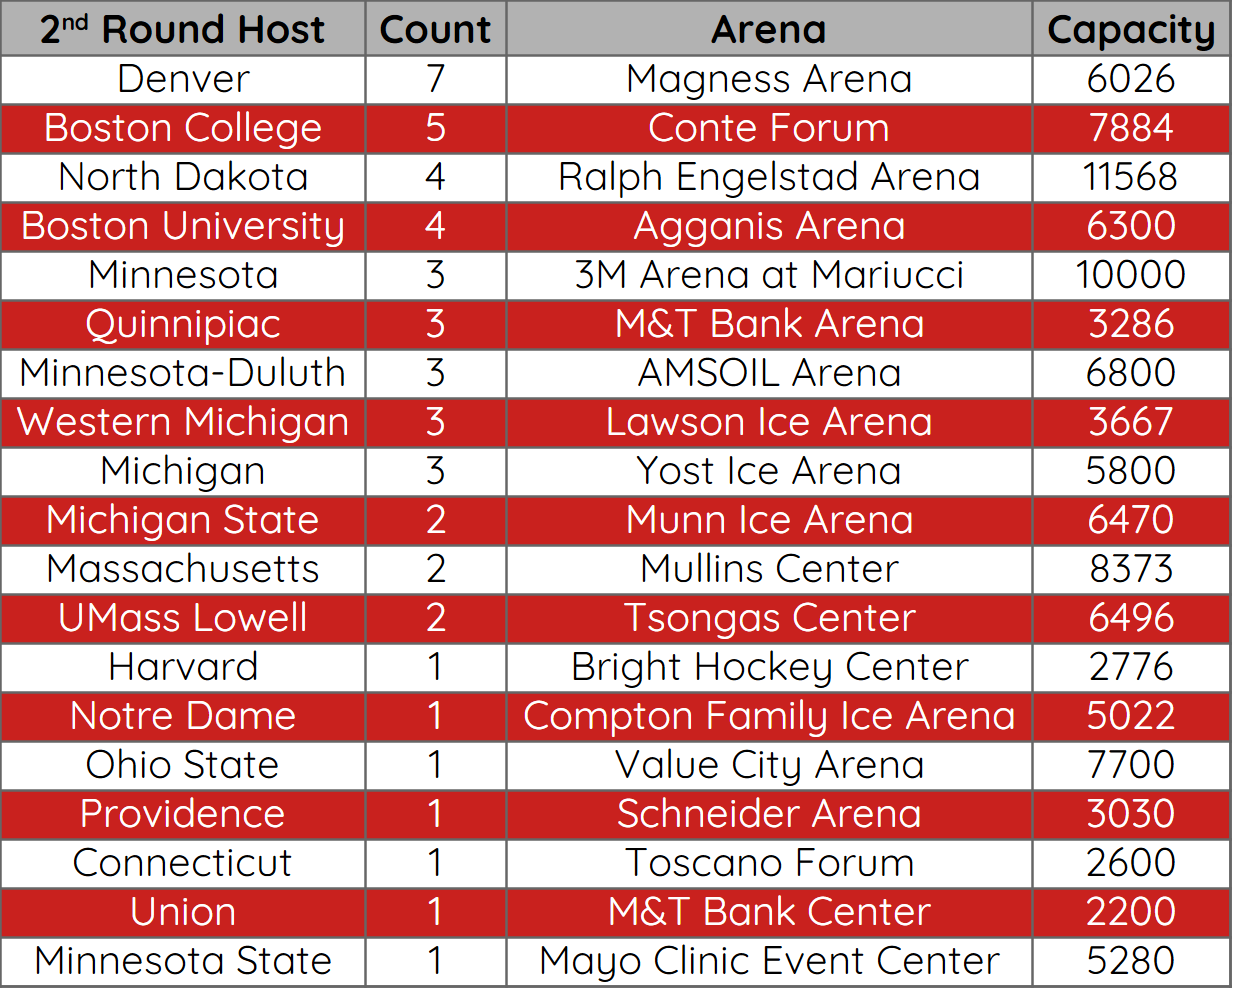
19 different venues would host 2nd round games, led by Denver who would host in 7 of 9 second round appearances, along with BC hosting all 5 of their 2nd round appearances and BU hosting 4, busing to UMass Lowell for 1, and flying for their other.
Looking just at the past 6 years, just 12 teams would host, led by BU, BC, Michigan, and Western Michigan who would host 3 times each.
Denver is the biggest beneficiaries of this system bring their total number of flights over 12 years from 9 to just 4 and dropping their average travel differential by 586.195 miles. Cornell goes from 1 flight to 5 in their 7 tournament appearances and increasing their average travel by 597.137 miles.
A downside of this system, is that it moves the second week of the tournament up against the Final Four—which is the reason why currently there is a week between the regionals and the Frozen Four. Also for fans, it is another weekend of travel and potentially hotels if they make it to the next round.
The total number of flights would increase from 90 to 102. Average combined travel distance for all teams in the a system in which the both rounds are hosted by the top teams host: 526.54, an increase of 6.54 miles.
Analysis
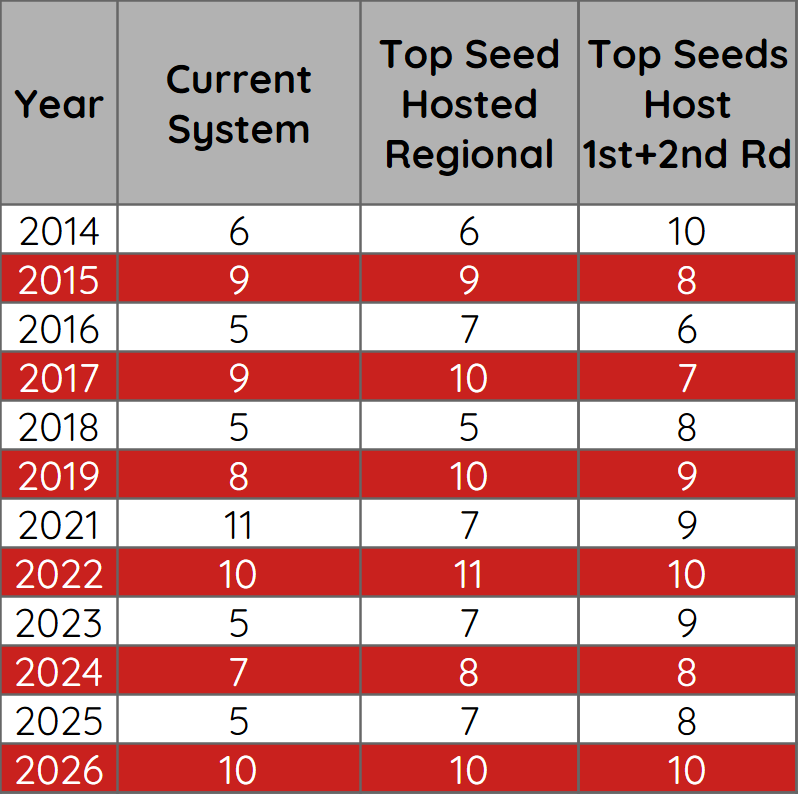
The only season the “Top Seeds” hosting the regionals would decrease total flights would be 2021. On only three occasions—2015, 2017, 2022—would the top remaining seeds hosting the 1st and 2nd rounds decrease the number of flights.
In the current system, 36 different teams have had to fly, just 18 have had to fly more than once. In the top seed hosted regionals, 41 different teams would be required to fly—23 more than once. When the top remaining seeds host over two weekends 38 teams require at least 1 flight and 22 would have to fly more than once.
Conclusion
Looking exclusively at flights and travel distance, for the vast majority of teams, on average, all three systems are not that different. The home-hosted regionals and the home-hosted 1st and 2nd round games would have issues for non-fans and potentially local fans alike being to get to tickets, due to limited capacity compared to current set up at some places. For example, Quinnipiac would be hosting 3-5 games at a 3.2k arena. If we’re going to change anything with host, let teams bid their own arena if it meets the NCAA minimum of 5,000 seats.
Beyond capacity, ticket prices would also be a concern. Single game tickets costing twice or even three times what normal tickets to a team’s game given the NCAA requires a minimum of $100,000 guarantee2 and the NCAA does not allow complimentary tickets to its championships3. As a result students would need to pay their own way into the game or schools or alumni groups would need to front the costs
None these solutions solve the biggest issue in getting people into arena, game schedule. Both of these systems would still be tied to a game schedule that prioritizes giving games their own TV window, leading to games at 2pm on Thursday. In a world where more teams would get home games, who are the ones that will be forced into the worse time slots? Surely not the teams that get a home tournament game once a decade. Getting a game schedule with more games at times that people could attend would do wonders to attendance. Additionally, the extra day in between game is a waste and makes it harder for people to travel. Going back to a Friday/Saturday, Saturday/Sunday schedule with games at 5 pm and 8pm local time would do extremely well.
2014 was chosen as it represents the start of most recent, major pairwise change i.e. H/A weighting, removal of the TUC, and addition of QWB